
In this quick post, we’ll see how to use Yellowbrick together with Matplotlib’s subplots feature to create a visual story about the modeling process:
Creating the subplots
First we have to use Matplotlib’s subplots feature to create a figure that will be able to contain two side-by-side subplots:
fig, axes = plt.subplots(ncols=2)
This will create a fig object, which is the entire space of our plot, as well as an axes object, which contains two ax objects that we will be able to access separately with numerical indexing.
Note: If we had written plt.subplots(nrows=2, ...) we’d get two plots stacked on top of each other instead of side-by-side.
Confusion Matrix
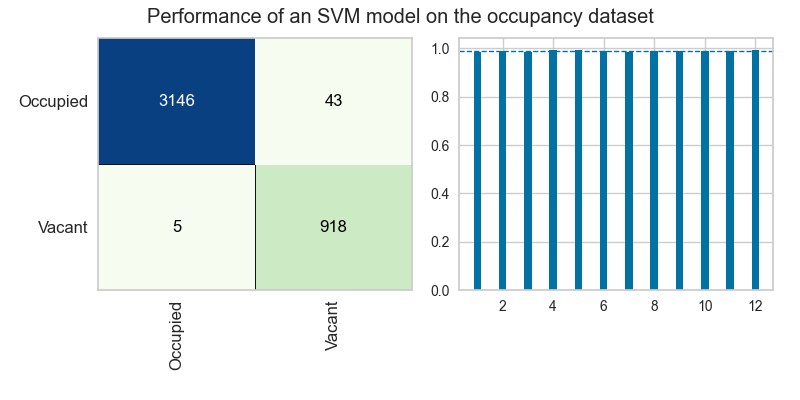
The Yellowbrick ConfusionMatrix visualizer is designed to help us understand where our model is making mistakes in classifying the training data. Because the visualizer accepts an ax parameter, we can pass in the coordinates of our first ax object directly into the visualizer on instantiation to tell it to position itself inside those coordinates on the figure we’ve created above.
confusion_matrix = ConfusionMatrix(
    model,
    ax=axes[0]
)
Cross-Validation
The Yellowbrick CVScores visualizer is part of the model_selection module, and is aimed at helping us to validate that our model is performing about equally well on all slices of our data during cross-validation. The CVScores visualizer also accepts an ax parameter:
cv_scores = CVScores(
    model,
    ax=axes[1],
    scoring="f1_weighted",
    cv=StratifiedKFold(n_splits=12, shuffle=True)
)
This code tells Yellowbrick to put the CVScores plot into the second of the two axes we created.
Putting all the pieces together
Here are all the pieces, put together (with a few other stylistic additions):
Note that in the above, we also use Matplotlib’s tight_layout method to encourage all of the features of the subplots to fit together nicely inside the figure. It’s very helpful when using many subplots! Check out this post for more examples of how to use Matplotlib effectively!